
Ask someone on land how the weather was, and they might tell you: “The forecast was completely wrong. It said it would be sunny today, but it rained.”
In reality, it was clear skies for 23.5 hours, with a brief 30-minute shower in the late afternoon. The daily weather icon on their phone simply summarised the 24-hour atmospheric cycle into a single image. The forecast wasn’t wrong—it was just an average, and the user expected a minute-by-minute guarantee.
When sailors complain on Facebook that “the weather apps are useless and always wrong,” it’s usually not the app that failed—it’s how the forecast was read. When someone says, “The app said 10 knots, but we got hit by 28,” they likely looked at an averaged wind arrow over a 3-hour window across a 9 km (ECMWF) or 22 km (GFS) grid area, completely missing the underlying model indicators that signalled gusts, atmospheric instability, or terrain effects.
Modern weather apps are impressive tools; we have never had so much meteorological data available at our fingertips. However, they still require human interpretation. At best, they output mathematical predictions based on spatial grids. To make practical tactical decisions along coastlines and in anchorages, those numbers must be weighed against local geography, model limitations, and real-time observations.
Key Takeaways for Skippers
- Global vs. Regional Models: Global models (GFS/ECMWF) smooth out islands and terrain. Use high-resolution regional models (AROME, ICON-EU) near land.
- Look for Model Divergence: High model agreement equals high confidence. When models disagree near land, instability is high—plan for the conservative forecast.
- Reef for Gusts, Not Sustained Wind: App gusts represent 3-second peaks over a broad grid. Near steep land, localised gusts can easily exceed app predictions.
- Track CAPE & Live Radar: High CAPE (>1000 J/kg) means loaded atmospheric fuel. Monitor Live Radar for real-time storm cell movement.
- Morning Tactical Windows: Convective heating peaks in late afternoon. Make your coastal hops early while the atmosphere is stable.
If you’re a developing skipper, combine this weather data with the All Winds Skipper Toolbox to assist with your daily go/no-go decisions.
1. Why Apps Sometimes Underpredict Wind Near Land:
Global vs. Regional Models
The default setting on most weather apps pulls from global numerical models like ECMWF or GFS. These models predict broad weather systems across entire continents and oceans using wide grid sizes—often 9 to 22 kilometres across.
There are also regional models like ICON-EU, NEMS, and AROME that use much smaller grids over specific regions. For example, AROME covers France, parts of the UK, Ireland, Germany, Switzerland, Spain, Portugal, and Italy at a fine 1.3 km to 2.5 km resolution.
Wide global grids cannot accurately account for micro-scale coastal features. If a narrow island channel, a cliff face, or a deep cove sits inside a 15 km grid box, the model effectively averages out the landmass. It simply doesn’t “see” the 300-metre hill compressing the breeze. While models predict broad funnelling in known hotspots like the Straits of Bonifacio, they frequently miss localised acceleration zones around headlands. This doesn’t mean the forecast is wrong; it means localised physics are amplifying the baseline mathematical forecast.
A classic example occurred while we were test sailing “All Winds” out of Stari Grad on Hvar, Croatia. The forecast predicted 15 to 18 knots upwind, which matched reality as we tacked out of the bay under a single reef. However, we knew terrain compression would accelerate the wind as we cleared the headland. The moment we rounded Kabal Point, the breeze instantly surged past 30 knots. We tucked in a second reef and rolled away more jib to keep the boat balanced. As we cleared the acceleration zone down toward Bol, the breeze settled back down to the baseline forecast.
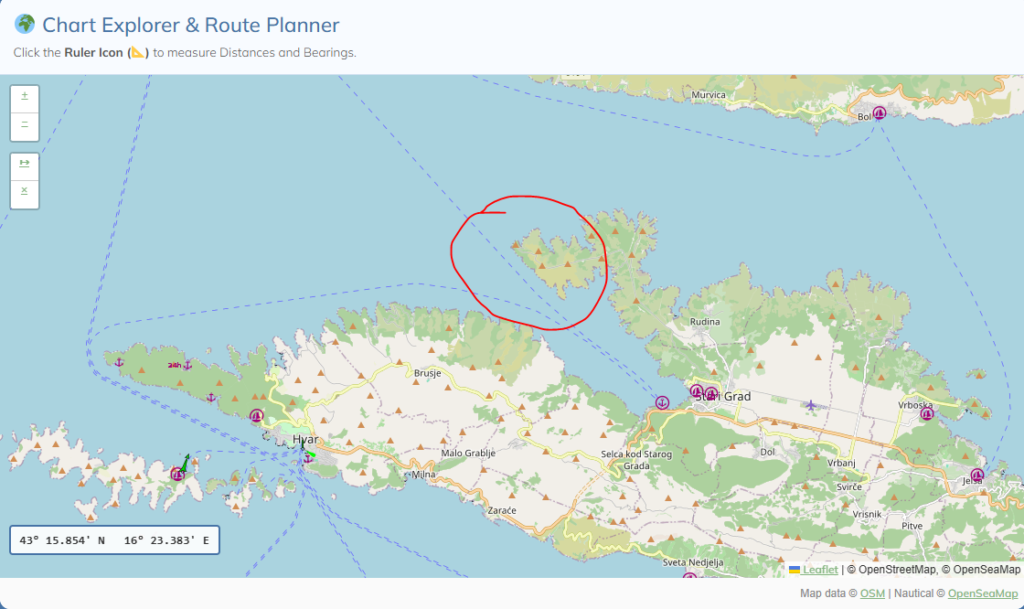
To get an accurate picture of your route, check ground winds and gusts, cross-reference local forecasts, compare regional models, and factor in terrain acceleration, thermal shifts, or wind-against-current conditions.
How to Get a Clearer Picture
Compare Models Side-by-Side: Always use the comparison feature on your app to view global models (ECMWF/GFS) alongside high-resolution regional models (AROME/ICON-EU).
Evaluate Agreement:
- High Agreement: If ECMWF, GFS, and AROME all predict 12 knots from the NW, your confidence in the general setup should be high.
- Model Divergence: If ECMWF predicts 8 knots, but AROME predicts 22 knots with heavy rain, the models are struggling with atmospheric instability. When models disagree near land, plan your day around the more conservative forecast.
2. Looking Beyond the Base Wind Layer
Single-line forecasts mask critical details. To understand the true state of the atmosphere, check four secondary layers:
Ground Wind vs. Wind Gusts
Sustained ground wind is a 10-minute average. Rigging and sails, however, are loaded by gusts. A forecast showing 12 knots sustained with 14-knot gusts indicates a stable breeze. A forecast showing 12 knots sustained with 26-knot gusts points to unstable air, land compression, or localised thermal activity.
Keep in mind that forecasted gusts represent an averaged peak 3-second gust measured 10 metres above the water. Near steep land, local gusts can spike higher. Interestingly, our experience shows that when sailing away from land influences, app gust layers are remarkably accurate to actual deck measurements.
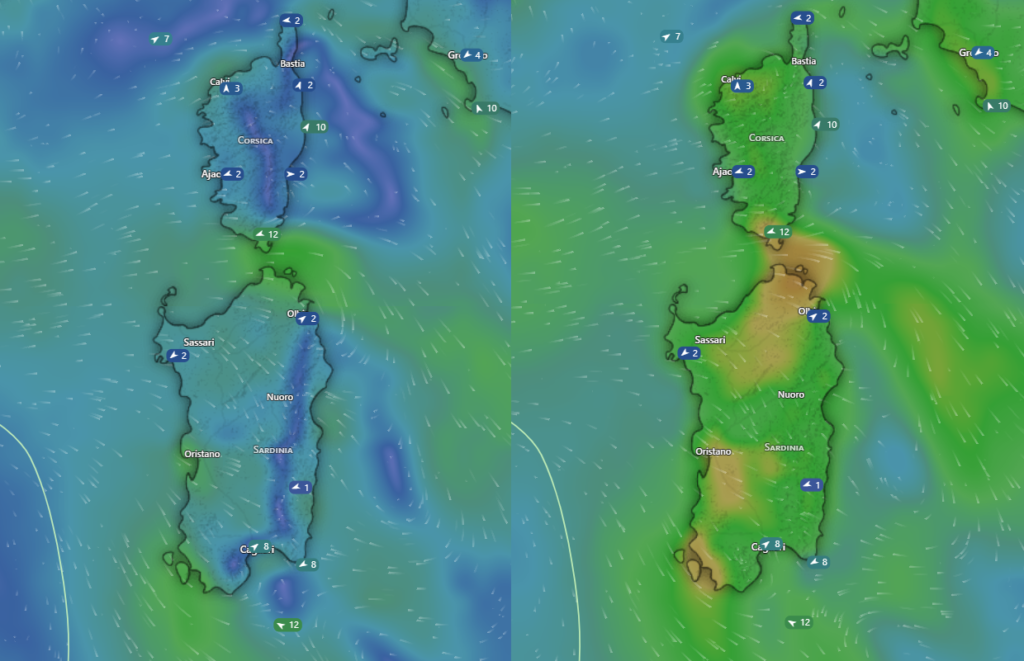
Synoptic Basics: Isobars & Spotting “Hidden” Fronts
Modern apps haven’t replaced traditional synoptic surface pressure charts—they’ve simply digitised them. Toggling on your app’s Pressure/Isobars layer provides an immediate regional synoptic overview:
- Isobar Spacing: Closely packed lines signal strong pressure gradients and heavy wind; wide spacing indicates light breezes under a high-pressure ridge.
- Spotting Hidden Fronts: Traditional Met Office charts explicitly draw cold and warm fronts using colored lines and symbols. Apps like Windy generally don’t draw front lines for you—but they reveal them if you know where to look.
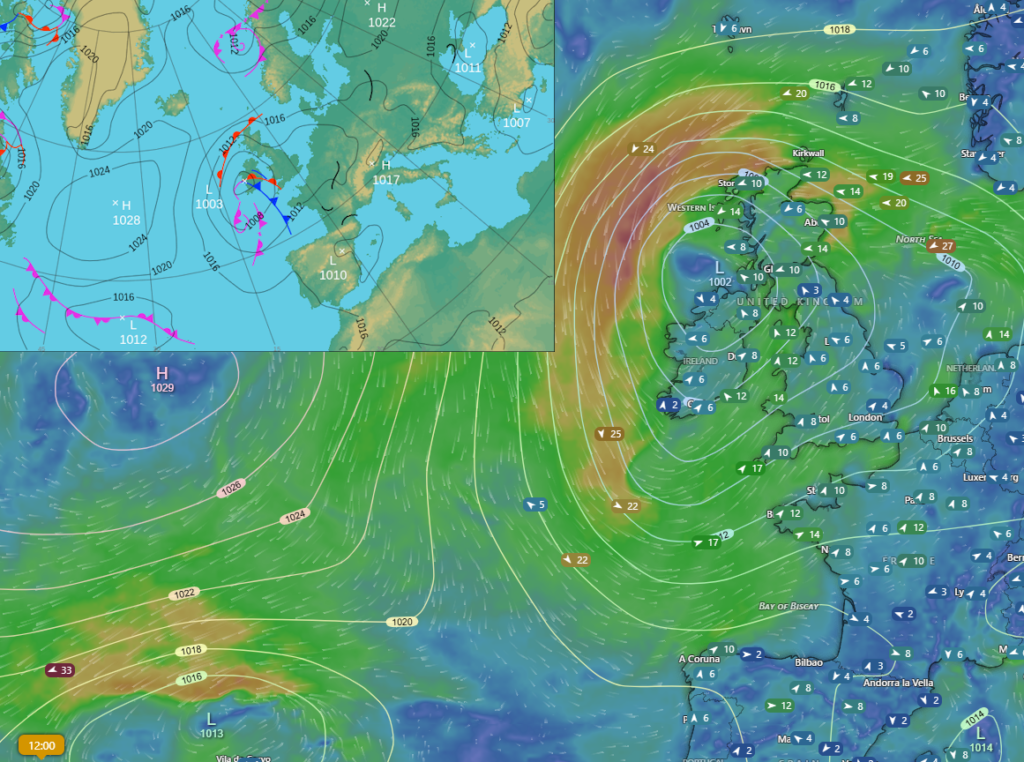
Look for sharp kinks or V-shaped bends in the isobars. Pressure changes rapidly across a frontal boundary, causing the isobar lines to kink rather than curve smoothly. Where you spot an isobar kink, cross-reference it with wind and temperature layers: you will almost always find a sharp wind shift, a sudden temperature drop, and heavy squalls right along that bend.
Rain/Thunder Forecasts vs. Live Weather Radar
- Rain/Thunder Layers: Show where a computer algorithm thinks precipitation might occur hours in advance.
- Live Weather Radar: Shows where precipitation and convective storm cells are actually moving right now.
Use forecast layers for morning planning, but switch to Live Radar when sitting in an anchorage watching dark clouds build over nearby mountains. (We discuss CAPE Index and thunderstorm development in detail in our post on Surviving the Dalmatian Nevera, which applies to convective squalls worldwide.)
The CAPE Index (Atmospheric Fuel)
Convective Available Potential Energy (CAPE) measures atmospheric instability in Joules per kilogram (J/kg). Think of it simply as potential atmospheric energy. CAPE is fuel, not a guaranteed storm. Think of high CAPE like a room full of gunpowder: the explosive potential is there, but without a spark (a trigger) to ignite it, nothing happens. You can feel CAPE in that sticky, heavy air we often associate with summer days that lead to thunderstorms in the evening.
- CAPE < 1000 J/kg: Low potential energy. The atmosphere is stable, making explosive afternoon squalls unlikely.
- CAPE > 1000–1500+ J/kg: High potential energy. The air mass is warm, moist, and unstable. Even if the base wind map looks sleepy, high CAPE means localised triggers can unleash sudden downdrafts.
CAPE and Triggers
The most deceptive conditions occur when you see flat, widely spaced isobars combined with high CAPE (>1500 J/kg). The app’s main wind layer will likely predict a peaceful 5-knot breeze all day. However, if secondary layers reveal atmospheric triggers—such as thunder probability on the rain layer, upper-level cold air moving in, or sharp sea-surface thermal shifts—building blocks are there for an intense thunder cell.
Standard model grids cannot project micro-scale convective cells onto the base wind map, so the app won’t explicitly warn you of high winds on your main screen. When high CAPE aligns with local triggers, ignore that calm 5-knot forecast and pick a secure, well-sheltered anchorage. If upper-level winds are blowing these cells towards you then you may get a very high-intensity thunder front, especially if the CAPE is very high >2500 or 3000J/kg
Wave Height vs. Wave Period
A sheltered bay may protect your hull from wind, but open swell can still wrap around headlands. Always pay attention to wave period: a 1-metre wave at a 4-second period produces a short, slamming chop, whereas a 1-metre wave at a 10-second period is a long, gentle swell.
3. Cross-Referencing Screens with Real-World Sensors
Apps provide a baseline prediction, but live observations reveal what is actually happening in your immediate area.
Live Coastal Weather Stations
Before setting sail, tap the live weather station icons along your route. Compare what the model predicted for the current hour against what coastal lighthouses or harbour sensors are actually measuring right now. If actuals are running 5 to 10 knots higher than predicted, conditions are escalating faster than the model anticipated.
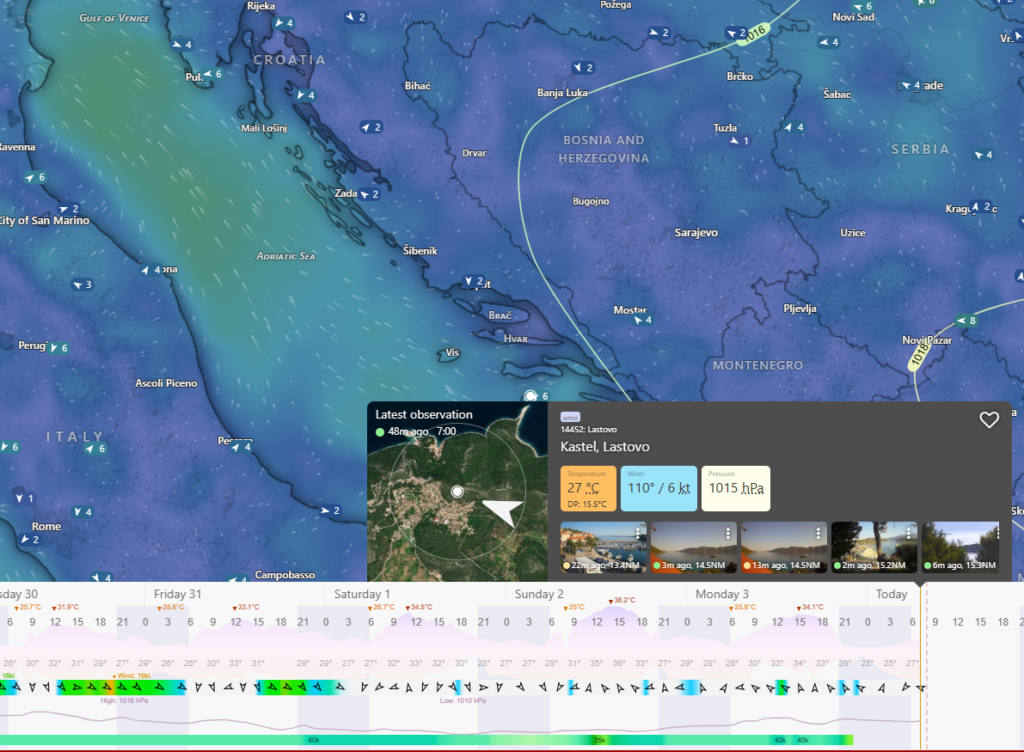
Apps like Windy display live reports from coastal stations alongside pressure reading overlays. By comparing your onboard barometer and anemometer against these live station reports, you can quickly evaluate whether real-world weather is tracking ahead of or behind the app forecast.
Cockpit Indicators
- Barometer Trends: A steady drop over 3 hours demands attention. A drop of 3 hPa in 3 hours indicates a tightening gradient with potential Beaufort Force 6 winds. A drop of 6 hPa signals potential Force 8 gale conditions, while a drop exceeding 6 hPa in 3 hours can indicate Force 10 storm-force winds.
- Sudden Temperature Drops: A sudden drop in air temperature—often felt as a cool breeze rushing into a warm anchorage—is the downdraft of a nearby convective cell pushing cold air from the upper atmosphere. Heavy wind is usually seconds away.
VHF Broadcasts vs. Starlink & Satellite Data
The way we receive forecasts at sea has undergone a quiet revolution. Satellite tech like Starlink and Garmin inReach now delivers updated models even when out of phone coverage.
However, having offshore data is only half the battle. Traditional coast station VHF broadcasts force you to sketch a broad regional synoptic picture in your head. High-speed connectivity is an incredible tool, but it shouldn’t shrink your focus down to the 5-mile bubble around your GPS position. Always weigh screen downloads against your onboard barometer, sea state, and synoptic trends.
4. Local Coastal Effects and Timing
Topography and daily temperature shifts create localised micro-climates that numerical models smooth over in their standard time blocks.
The Diurnal Strategy: Work with the Morning Window
Convective heat builds throughout the day, peaking in the mid-to-late afternoon as land reaches maximum temperature. If forecasts show high CAPE or afternoon thunderstorm potential, make your moves in the morning. Departing at or before 08:00 allows you to complete your passage in stable air and be safely anchored before afternoon thermal engines fire up. (assuming morning conditions are stable)
Nighttime Land Breezes & Katabatic Gusts
At night, land cools faster than the sea, reversing daytime thermal breezes. If anchored under steep hills, cold air pooling on the peaks can spill down the slopes overnight. Even without a major synoptic feature like a full Bora, light gradient winds across a ridge combined with surface cooling can generate sudden katabatic gusts hitting an anchorage at 03:00 AM.
We experienced this firsthand while anchored in Vasiliki Bay. Cloud cover gathered over the mountain, and a light gradient breeze shifted slightly further north than normal, sending sudden katabatic gusts of 30 to 40 knots hammering down the valley into the bay. Along mountainous stretches of Croatia and Albania where cliffs drop straight to the sea, anchoring right under the land might feel sheltered, but it can position you directly in the firing line as katabatic gusts roll over the edge.
Fetch and Wind Direction
An offshore breeze blowing off high cliffs creates flat water near the beach, but terrain compression over the ridge can increase wind speed on deck. Conversely, that same wind speed blowing onshore across miles of open fetch creates a rough sea state and a dangerous lee shore. The wind arrow on your screen looks identical in both cases, but the safety implications are completely different.
5. Decision-Making in Practice: Four Real Examples
The following scenarios demonstrate how forecast models, CAPE values, and local observations combine to inform practical seamanship decisions:
| Scenario | Observations & Data | Tactical Decision | Result |
| 1. Albania to Montenegro (Routing Around Energy) | High CAPE present. Updated forecasts showed trigger zones shifting toward Shëngjin Bay, with upper-level jet stream winds pushing developing cells seaward. | Delayed departure past peak convective hours. Plotted an offshore arc 15–20 miles out to clear the coastal trigger area, keeping an option to run to Italy if conditions deteriorated. | Smooth passage offshore. Observed sheet lightning along the distant coast while remaining in clear, steady conditions out at sea. |
| 2. Bar to Bigova (Model Divergence) | High CAPE, mountain triggers, and significant model divergence (ECMWF and regional models disagreed on timing and severity). | Treated model disagreement as a clear sign of atmospheric instability. Remained safely in port at Bar. | A severe thunderstorm passed through that evening. A vessel that departed for the open bay at Bigova dragged its mooring during the storm. |
| 3. Orbetello to Taverna (Model Convergence) | Steady northerly airflow, minimal gap between gusts and lulls. All models showed complete agreement, matching our onboard measurements. | Proceeded with a planned 70 NM nighttime crossing from mainland Italy to Corsica. | Ideal sailing at 6 knots under moonlight with consistent breeze until reaching Corsica—exactly as indicated by model convergence. |
| 4. Low-Energy Thunderstorm (Calculated Hold) | Apps displayed generic thunderstorm icons. However, CAPE was low (<1000 J/kg), and holding in the anchorage was thick mud. | Decided to remain at anchor. Deployed extra chain, prepped the deck, and monitored Live Radar rather than rushing to a crowded marina. | Rain and minor wind gusts passed through as expected. The anchor held firm with minimal disruption. |
6. Deck Preparation and Anchoring Practicalities
When choosing to stay at anchor during unsettled weather, digital tools take a backseat to physical seamanship.
Setting the Anchor Properly
Before trusting your tackle overnight, dig the anchor in firmly by backing down at 2000+ RPM in reverse once proper scope is deployed. If the fluke doesn’t hold under that load, reset it. Always rig a snubber to absorb shock loads and protect your windlass. (Keep in mind that when an incoming storm front hits, the wind direction can instantly shift 180 degrees from where your anchor was initially set! Plan scope and clearance accordingly.)
Managing the Tender
If there is a chance of overnight squalls, avoid leaving the dinghy on a long painter trailing off the stern. If you need to manoeuvre or re-anchor at 02:00 AM, a floating painter presents an immediate prop-wrap hazard. Secure the tender alongside or hoist it onto deck.
Clear Exit Paths
Anchor in a position that offers a direct, uncomplicated path out into open water. In the event you need to weigh anchor in darkness, you should be able to steer straight out without weaving around shallow reefs or tightly packed yachts.
Physical Monitoring vs. Phone Alarms
While smartphone anchor alarms are popular, GPS drift in steep coves often triggers false alarms or fails if satellite connection drops. Rely on physical monitoring:
- Keep sightlines clear: Leave forward hatch blinds open so you can quickly reference land silhouettes against the night sky.
- Sense the vessel: Learn to recognise the distinct rumble and vibration of an anchor dragging across the seabed. Physical awareness remains one of the most reliable monitoring tools on board.
Summary
Modern weather apps provide extraordinary data, but they output mathematical estimates based on grid boxes rather than guarantees. By comparing regional models, analysing secondary layers like gusts and CAPE, accounting for diurnal timing, and maintaining sound deck preparation, you can accurately interpret app data and make confident, safe tactical decisions at sea.
There is no single “best” model. For general trends, ECMWF is widely considered the most accurate global model. However, for coastal sailing, high-resolution regional models like AROME (1.3 km grid for Western Europe) or ICON-EU (7 km grid for Europe) are far superior at predicting terrain compression, sea breezes, and coastal funnelling.
Global models use wide spatial grids (9 km to 22 km wide). If a mountain, cliff, or narrow strait sits inside a single grid box, the computer algorithm smooths the landmass out into an average elevation. It misses local terrain effects like mountain compression, cape acceleration, and localised thermal engines.
A CAPE value below 1000 J/kg indicates low atmospheric energy and stable conditions. Values between 1000 and 1500+ J/kg signal high potential atmospheric energy. When CAPE exceeds 1000 J/kg, localised triggers (like afternoon land heating) can rapidly turn calm conditions into violent convective squalls.
Not necessarily. A bad forecast for an open stretch of water often means you can adapt your itinerary to sail in sheltered channels or anchor on a lee shore. However, safety must remain priority number one. If the weather presents high atmospheric energy, poor holding, or exposed coastlines with no clear backup options, remaining securely tied up is proper seamanship.
Check for updated model runs two to four times a day (most models update every 6 to 12 hours). Perform a final update right before casting off, and switch to Live Weather Radar and local coastal station readings during the afternoon or when anchored in unsettled conditions. On Windy, it will tell you when the last update was made and when the next one is due, where you select the models.
Reef early before wind spikes hit, cross-reference live radar to track incoming cells, and evaluate your nearest emergency shelter options. Never wait for the anemometer to hit 30 knots before reducing sail area if your barometer is falling or temperature drops suddenly.
Apps usually display sustained wind averaged over a 10-minute period across a wide grid area (often 9 to 22 km wide). Near land, localised terrain compression around headlands, katabatic mountain gusts, or convective squalls can easily push real-time wind speeds 10 to 15 knots higher than the app’s baseline average.
Both use the same core global models like ECMWF, so they share the underlying source data. The main difference lies in interface tools and features. PredictWind historically offered superior weather routing, while Windy excelled at visual overlays and live station data—though Windy now supports plugins that bring routing directly into the app.

No responses yet